Enter Virtualization, the technique that transforms sluggish data grids into lightning-fast experiences.


The Problem
Traditional data grids render every single row and column, whether visible or not. This leads to:
- Memory bloat from unnecessary DOM nodes.
- Sluggish scrolling due to rendering overhead.
- Slow initial loads as browsers process massive DOM trees.
- Potential crashes with extremely large datasets.
The Solution
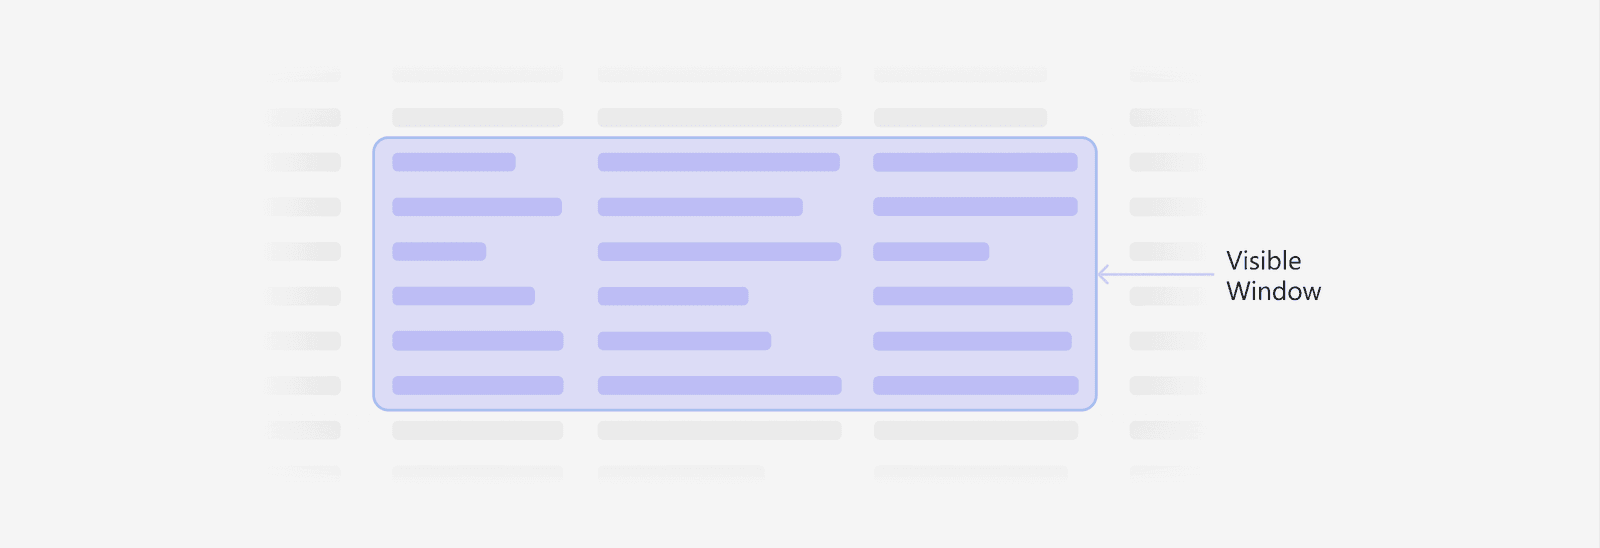
Virtualization (aka “windowing”) renders only what users can see, plus a small buffer for smooth scrolling. Instead of hundreds of thousands of DOM nodes, only ~20–30 rows stay in memory.
The magic happens through:
- Calculating visible viewport
- Rendering only visible items + configurable buffer zone
- Dynamically creating and destroying elements during scroll
- Reusing existing DOM nodes
Building a Virtualized Data Grid
Virtualization can be achieved in React using third-party libraries like:
- react-window
- react-virtualized
- TanStack Virtual
TanStack Virtual is preferred over other libraries, this is because it offers a headless API with maximum flexibility, precision control over virtualized nodes, and performance optimizations for complex and dynamic layouts. This makes it ideal for data-intensive applications. Here is a comprehensive implementation guide for creating a high-performance virtualized data grid using @tanstack/react-virtual package that can handle thousands of rows with enhanced user experience.
1. Setting Up the Foundation
Start with establishing the core structure using the useVirtualizer hook. This hook requires three essential parameters:
- The total count of rows
- A reference to the scrollable element
- Estimated size of each row
Virtualization works by calculating items that should be visible based on the current scroll position.
2. Creating the Container Structure
The virtualized grid requires a three-layer container approach for optimal performance. The outermost container serves as the scroll viewport with a fixed height and overflow properties. The inner container maintains the total calculated height of all items to preserve proper scrollbar behaviour. Individual rows are the absolutely positioned using CSS transforms, which provides superior performance compared to traditional positioning methods.
3. Implementing Row Virtualization
The row virtualizer declared earlier handles vertical scrolling by managing which rows are currently visible. Using the overscan property creates a buffer zone that renders additional rows above and below the visible area, ensuring smooth scrolling without content flashing. The virtualizer automatically calculates the start and end positions for each visible row, allowing for precise positioning within the scroll container.
const rowVirtualizer = useVirtualizer({
    count: rows.length,
    getScrollElement: () => parentRef.current,
    estimateSize: () => 35                     //Standard row height
  });
4. Adding Column Management
For data grids with numerous columns, horizontal virtualization is equally important. We use a separate column virtualizer that works collaboratively with the row virtualizer. This dual-virtualization approach ensures that both dimensions remain performant, especially when dealing with wide tables that extend both horizontally & vertically.
const columnVirtualizer = useVirtualizer({
  horizontal: true,
  count: columns.length,
  getScrollElement: () => parentRef.current,
  estimateSize: () => 150                    //Standard column width
});
5. Handling Dynamic Content
Data grids can contain variable-sized rows due to dynamic content like text wrapping or embedded components. We accommodate this through the measureElement ref callback, which allows the virtualizer to measure actual rendered dimensions and adjust calculations accordingly. This measurement system ensures accurate scrollbar behavior and positioning even with content of varying heights.
const virtualRows = rowVirtualizer?.getVirtualItems();
const virtualColumns = columnVirtualizer?.getVirtualItems();

const gridRows = virtualRows?.map((row) => (
  <div
    key={row?.key}
    style={{
      transform: `translateY(${row?.start}px)`,
      height: row?.size,
      width: '100%'
    }}>
    {virtualColumns?.map((column) => (
      <div
        key={column?.key}
        style={{
          transform: `translateX(${column?.start}px)`,
          width: column?.size,
          height: row?.size
        }}>
        {row?.[row?.index]?.[column?.item?.code]}
      </div>
    ))}
  </div>
));
6. Optimizing Performance
Several performance optimizations enhance the grid’s responsiveness. The scroll margin property accounts for any offset elements like headers or navigation bars. Gap support creates consistent spacing between items without requiring additional wrapper elements. The initial measurements cache preserves previously calculated measurements, reducing recalculation overhead during navigation or filtering operations.
7. Integration with Data Management
The virtualized grid integrates seamlessly with state management and data fetching patterns. When combined with libraries like React Query, the implementation can handle real-time data updates while keeping scroll position and user context. The virtualizer automatically recalculates when the underlying data changes, making it suitable for frequent updates on the grid.
const { data: rows = [] } = useQuery({
  queryKey: ["gridData", page],
  queryFn: fetchRows,
  keepPreviousData: true,
});
Keep page-sized chunks in cache, drop far-away pages, and rehydrate from cache when users scroll back.
Implementation Best Practices
1. Buffering & Overscan
- Always rendering a small number of rows/columns outside the screen dimensions avoid flicker when scrolling quickly and maintaining smoothness.
2. Efficient Row Height & Column Width Handling
- Using fixed heights/widths if possible (simplifies calculations, faster)
- If dynamic sizes are needed, caching row/column measurements. Using approximate size and adjust after render
3. Data Loading & Caching
- Implementing lazy loading/infinite scrolling with virtualization
- Caching previously loaded pages of data for back-scroll
- Dropping far-off data for keeping memory usage in check
4. Performance Monitoring
Profiling the following using developer tools like Chromium browser’s performance tab, React profiler, Lighthouse:
- FPS while scrolling
- Memory usage from long-running sessions
- CPU spikes from re-renders
5. A11Y
- Using grid semantics like role=”grid”, aria-rowcount, aria-colcount
- Implementing roving tabindex: only one tabbable cell at a time
- Keyboard navigation: Arrow keys move focus within the virtualized region; handle Home/End/Page Up/Page Down
- Exposing search or jump that operates on the dataset, not just visible DOM
- Announcing loading/infinite scroll via aria-live regions
Benchmarking
To understand the real impact of virtualization, we tested a Data Grid with 100,000 rows × 20 columns (2 million cells) on a standard system.
Test System Specifications
- CPU: Intel Core i5–1135G7 (4 cores, 8 threads, 2.4GHz base / 4.2GHz turbo) or equivalent mid-range processor
- RAM: 16GB DDR4
- Storage: 512GB SSD (NVMe)
- Graphics: Integrated
- Browser: Microsoft Edge version 140 (Latest stable at time of writing)
Test Results
| Indicator | Without Virtualization | With Virtualization |
|---|---|---|
| DOM Nodes | ~2,000,000 elements | ~1,000 – 2,000 elements |
| Initial Render Time (TTFR) | 5 – 30s | 100 – 300ms |
| Memory Usage (steady) | 1 – 2GB+ heap | 50 – 100MB heap |
| Memory Spike (scrolling) | +500MB – 1GB | +10 – 30MB |
| Frame Rate (scrolling) | <5 – 10FPS | 50 – 60FPS |
| Input Latency | 1 – 5s delay | <50ms |
| CPU Utilization (scrolling) | 80 – 100 % | 20 – 40% |
Roughly 35x faster rendering with a fraction of the memory footprint.
Closing Remarks
Implementing virtualization wasn’t just about speed — it was about sustainability. By rethinking how our grids render, we’ve reduced memory overhead, improved usability on lower-end devices, and simplified maintenance.
Subscribe for updates and stay informed with our latest insights, news, stories, and announcements.
Other Articles you may like: